Table of Contents
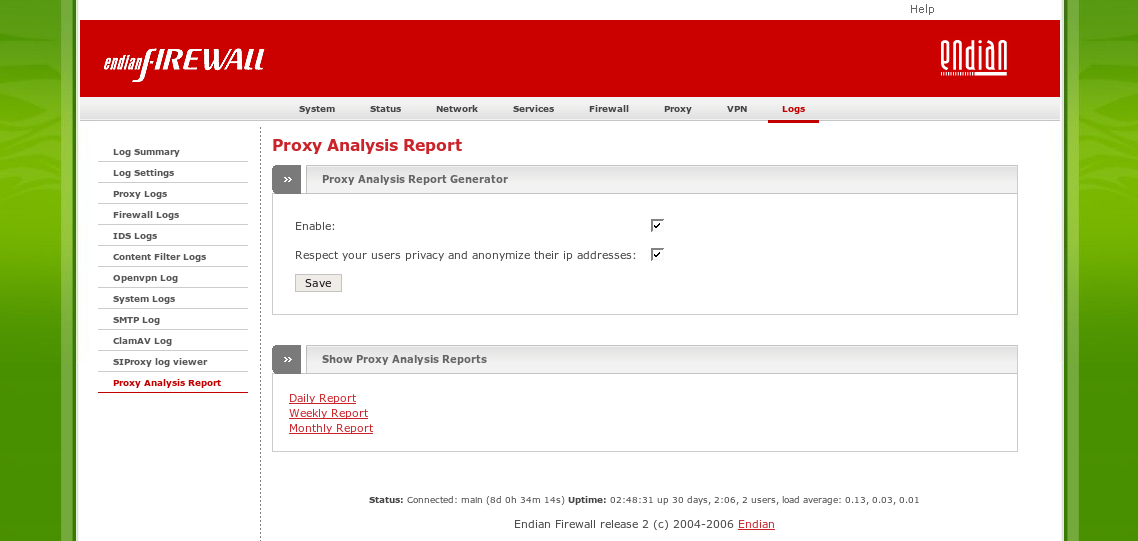
The Logs administration page consists of these sub-pages:
The log viewer pages share a common set of interface features to select the log information to be displayed and to export that information to your local machine. By default the log viewer always shows you the most actual log lines as they appear in the log files. The information is shown as a list (usually labeled log) of all log entries in the main section of the window. If that list is too long to fit into a reasonably sized window, only the latest logs entries are displayed. In that situation, the Older and Newer links at the top and bottom of this section of the window become active and you may use these to page through the list of Logs data.
Since the amount of data created by the log files can become literally huge, log files are rotated weekly in order to keep the actual file small. During a rotation the logfile will be moved away, compressed in order to save disk space and and a new one will be created. Therefore you will have a log file for each week and each log file may contain more or less data then the last one. The so archived log files will remain on the disk for 52 weeks until they will be deleted.
The log viewer enables you to navigate through the entire amount of log lines. If you reach the end of one file the next file will be automatically used. In order to know where exactly you stand within the log lines the following informational line displays some information:
Total number of lines matching selected criteria: 1054 - File: 1/14 - Offset: 1/8
As the line says, the first number shows you the total amount of lines which match the selected criteria. It can be that the lines are split within more different log files, so in some situations you need to jump back nevertheless there where enough space to fit all lines within the page.
The numbers after the label File informs you about the actual logfile you are showing and of the total number of archived and not archived log files for the current service.
The next numbers after the label Offset, shows you the current position within the log file. The first number informs about the page number you are currently displaying while the second stands for the total pages which the current log file contains.
The following desribes the common interface elements which you can use to take affect to the displayed log lines:
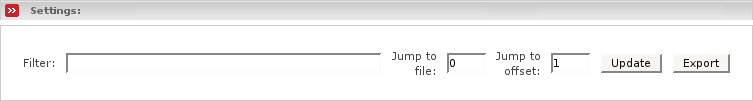
- Filter
The Filter edit field lets you define a search term which will be searched in the log files. The viewer then displays only those lines which contain the search term. This field accepts also perl compatible regular expressions. After you changed the value in this field you need to press the Update button in order to reflect the changes in the logviewer output.
- Older
This button allows you to cronologically jump back within the log entries. The button will disappear if there are no older log entries.
- Newer
This button allows you to cronologically jump forth within the log entries. The button will disappear if there are no newer log entries.
- Jump to offset
Instead of pushing the Older or Newer buttons as long as you need to reach a desired page, you can simply jump directly to a specific page if you know the exact position. You can certainly also jump to an estimated position and then use the Older/Newer buttons to reach the desired position.
- Jump to file
Enables you to directly jump to a specific archived file. Pressing the Older button again and again, lets you jump back page by page. If you reached the last page of the current file, the next elder log file will be opened if you push the Older button again. Using Jump to file is just a faster possibility to reach a desired place within the whole amount of data.
- Export
Pressing the button downloads a text-format file (log.dat), containing the information from the current Logs page, from the Endian Firewall to your computer. Depending on how your computer is set up, pressing the button will initiate a file download dialogue on your computer, show the contents of log.dat in your web browser window, or open the file in a text editor. In the latter cases, you can save log.dat as a text-format file if required.