To access the Endian Firewall GUI is as simple as starting your browser and entering the IP address (of the green EFW interface) or hostname of your Endian Firewall along with a port director of either 10443 (https/secure) or 80 (redirected to 10443).
The system will ask you for username and password: user: "Admin", password:"the password that you set during the installation process"
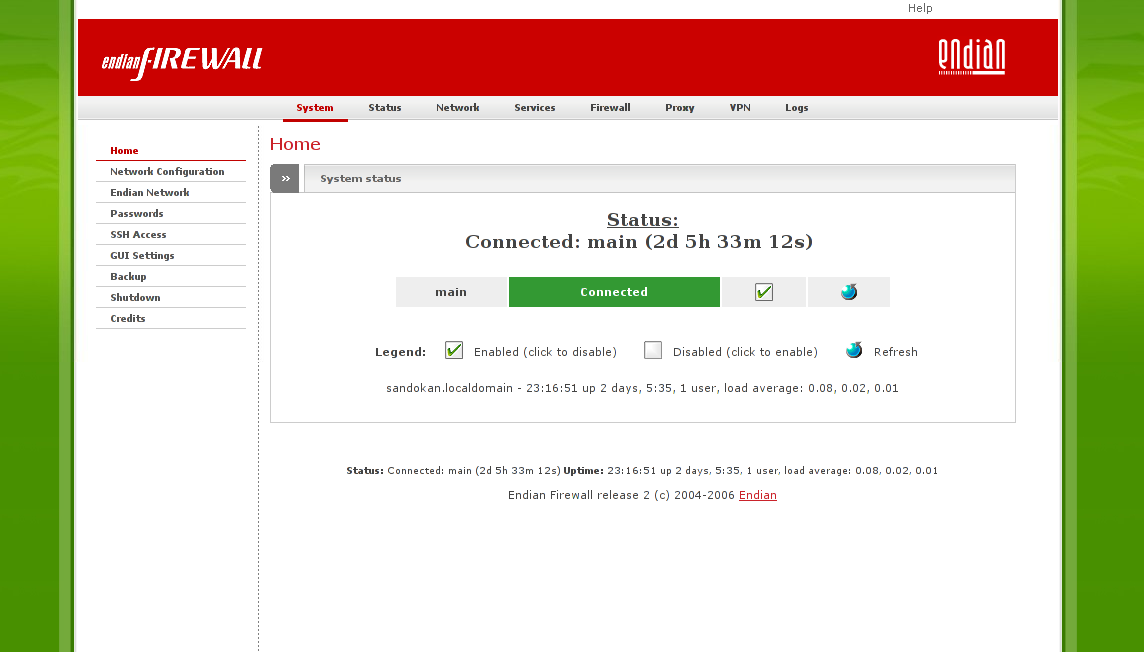
You should now be looking at the Home Page of your Endian Firewall GUI. You can immediately start exploring the different options and the information available to you through this interface. Below, we have listed the Main Configuration/Administration Options available through the GUI. When you have acquainted yourself sufficiently with the system, please continue with the next section.
Endian Firewall's Administrative web pages are available via the menu the top of the screen.
System configuration and utility functions associated with Endian Firewall itself.
Displays detailed information on the status of various portions of your Endian Firewall.
Used for the configuration/administration of your dial-up/PPP settings.
Configuration/Administration of your Endian Firewall Services options.
Configuration/Administration of Endian Firewall's firewall options.
Configuration/Administration of Endian Firewall's HTTP and POP3 proxy (also antivirus, antispam and content filter configuration).
Configuration/Administration of your Endian Firewall Virtual Private Network settings and options.
View all your Endian Firewall logs (firewall, IDS, proxy, etc.)
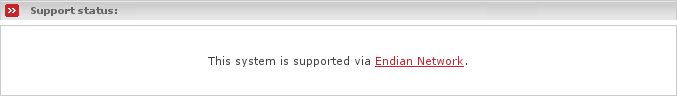
In the first page section, you see the Endian Commercial Support Status. This is only available for Endian Firewall Enterprise version. To get more information about the Endian support program, visit our Homepage on http://www.endian.it. (This box is not displayed in version 2.1)
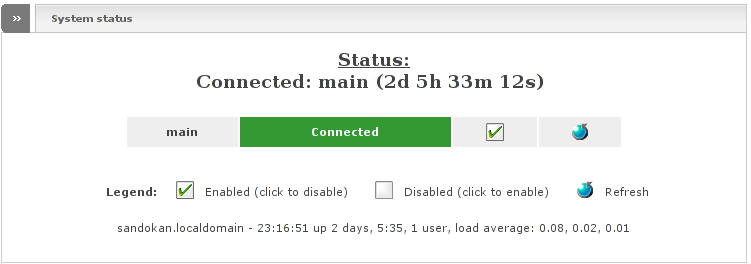
In the following box you will see information about the system status. The first part gives short global information about the connection status, while the second part gives more precise information about each uplink. After the connection status you can see short information about the systems health.
Note
You will not see an active connection until you have finished configuring your Endian Firewall.
- Short connection status display
The current connection status of the Firewall will be displayed here, followed by the connection time. The connection status can be one of the following:
Idle - No connection to the Internet and not trying to connect.
Dialing - Attempting to connect to the Internet.
Connected - Currently connected to the Internet.
If you are currently connected to the Internet you will see a Connection status line in the following format:
Connected ( #d #h #m #s)
d=Days connected
h=Hours connected
m=Minutes connected
s=Seconds connected
- Connection status
In the following table you will see the actual connection status of each uplink respectively.
The first cell shows you the name of the uplink. Normaly you will see only one uplink which then is called "main", since it is the primary uplink.
The second cell shows you the connection status of respective uplink. Below we will describe the different status possibilities which you may find here. In the third cell you have the possibility to manually connect the uplink if it is disconnected or the contrary. Once you have pressed the respective connect or disconnect button you will need to wait until the connection has been connected/disconnected sucessfully. During this process you may reload the page using the refresh button on the right. You will notice that the connection status field will change it's content.
Values for the connection status:
- Connected
The uplink is connected and fully operational.
- Stopped
The uplink is not connected.
- Dead link
The uplink is connected but the following gateways could not be reached, so in fact the uplink is not operational. Endian Firewall tries to ping the following gateways and announces if the link gets back working.
- Failure
There was a failure while connecting to the uplink.
- Failure. Reconnection
There was a failure while connecting to the uplink. Endian Firewall will try to reconnect within the time interval which will be printed out.
- Disconnecting
The uplink is actually disconnecting.
- Connecting
The uplink is actually connecting.
- System health line
Below your connection status line you will see a line similar to the following:
19:07:10 up 1 day, 7:21, 0 users, load average: 0.03, 0.01, 0.00
This line is basically the output of the Linux uptime command and displays the current time, the days/hours/minutes that Endian Firewall has been running without a reboot, number of users logged in, and the load average.