New in version 6.5: Network Awareness
Your Network
This page is part of part of the Endian Network Awareness feature set which displays real-time interactive network information at a glance so administrators can analyze and react (if necessary) to dangerous or inappropriate network activity.
Overview
By default, the network data is sampled every 5 seconds to give you a real-time view of what’s happening on your network. This is indicated by the Live data as shown in the upper right. In addition, you will find three buttons described below:
: This will pause the live network recording. This can be useful when want to freeze the data in the current window. Once clicked, you can resume live data display by clicking .
: This will open the Network History interface where you can view and replay network activity from the last 12 hours.
: This will open the Settings page with the following options:
Your Agent ID - This display your Network Awareness Network ID which is unique to your UTM.
Enable flow processing - Enable this feature to locally capture and process network flow information. Disabling this feature will disable the local processing and display of network data.
Enable active scan - Enable this feature to allow the Endian to scan detected hosts for information like IP/MAC addresses, operating system, and running services information.
- Click to save any changes made on this page.
Across the top of this section are three real-time graphs and charts:
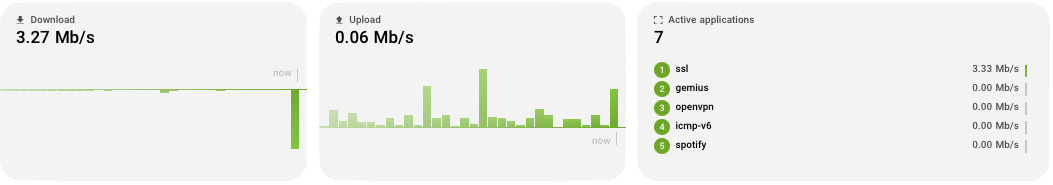
Download: View the download activity of your network in real-time. Shows the download activity in a rolling chart that display the previous 3 minutes of activity. The height of each bar represents the amount of download proportional to the previous activity.
Upload: View the upload activity of your network in real-time. Shows the upload activity in a rolling chart that display the previous 3 minutes of activity. The height of each bar represents the amount of upload proportional to the previous activity.
Active applications: The large number listed under the heading indicates the real-time total number of applications detected on the network based on all active flows. Underneath are the top five (5) applications in use on the network updated in real-time. The list displays the applications in order from highest throughput (upload or download) of a given application.
Devices Tab (Table)
Here you can see a real-time table of the devices detected on the networks sorted by default in descending order of the highest throughput (upload or download). Essentially you are viewing the most “active” devices in the network based on current throughput - those who are sending or receiving the most network data. The following information is displayed for each of the devices listed:
Name: This shows the name of the device which is displayed based on the available information in the following order:
Manual user entry: Using the device editor an admin can explicitly set the name they wish to display for a given device.
DHCP hostname: If the UTM is acting as a DHCP server and a given device offers its hostname as part of the DHCP process, this will be displayed.
IP address: If none of the above are available, then the IP address of the device is displayed.
Underneath the name is displayed the MAC address and the vendor (usually device manufacturer) based on a MAC vendor lookup.
Download: The current download throughput for this device.
Upload: The current upload throughput for this device.
Applications: Here the number of applications detected for this device are displayed along with a badge representing the network zone associated with the device.
Status: This can be one of two values:
Online: If the host has been recently active (within the last 3 minutes), then it will display Online with a graph underneath representing recent activity.
Offline: If the device has not been active recently (within the last 3 minutes), the it will display Offline with an indication of time lapsed since the device was last seen on the network. By default, after 30 days the host will be removed from the device history.
Device Details: On the far right is a button
which will pop-up the device details interface on the right-hand side of the page with the following information:
At the top right are pop-up window controls including:
Pop-out Window: Click here to make the Device Detail window a standalone, movable window. Once clicked, you can reattach to the side of the window by selecting this button again.
Minimize: Click here to minimize the Device Detail window to the bottom. This makes the window easily accessible again from the main interface.
Close: Click here to close the pop-up window.
Overview
Edit icon: Click to manually set device name or delete device.
Download: The total download throughput for this device.
Upload: The total upload throughput for this device.
MAC address: The MAC address of the device.
IP addresses: Here is listed all detected IPv4 and IPv6 addresses of the device.
Hostnames: Here is listed all the detected hostnames of the device.
Network Activity Graph: A graph representing recent network activity of the device.
Below you will find a tabbed interface with the following items:
Info: Here will be listed any detectable Operating System information including OS name, version, type and vendor.
Flows: Here you can see all real-time flows which contain this device as a source or destination and includes:
From: Displays the source IP address along with source port and detected application in use.
To: Displays the destination IP address and port.
Throughput: Displays the real-time throughput values including both upload and download.
Services: Here you can find detected services running on the device. The services are detected via a active scan which is queued after a new host is detected. If no services were detected by the scan, then no services will be shown.
Above the table, different widgets are shown.
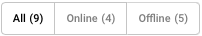
On the right-hand side, a set of buttons will allow to populate the table with only the devices that are in a given state; it is possible to show All devices, or only those that are in a current state of Online or Offline simply by clicking on the button.
Flows Tab (Table)
Here you can see a real-time table of the network flows detected on the networks sorted by default in descending order of the highest throughput (upload or download). Essentially you are viewing the most “active” connections in the network based on current throughput - those who are sending or receiving the most network data. The following information is displayed for each of the flows listed:
Application: This displays the name of the detected application in addition to the network protocol identified, the destination fully-qualified hostname (if available) and the associated UTM network zone.
From: This displays the source device name along with associated IP address and port.
To: This displays the destination device name along with associated IP address and port.
Download: The current download throughput for this flow.
Upload: The current upload throughput for this flow.
Flow Details: On the far right is a button
which will pop-up the flow details interface on the right-hand side of the page with the following information:At the top right are pop-up window controls including:
Pop-out Window: Click here to make the Flow Detail window a standalone, movable window. Once clicked, you can reattach to the side of the window by selecting this button again.
Minimize: Click here to minimize the Flow Detail window to the bottom. This makes the window easily accessible again from the main interface.
Close: Click here to close the pop-up window.
Overview
Throughput: The total of the upload and download throughput for this flow.
Total traffic: The total amount of network traffic sent for this flow.
Generated by: The detected device type (if available).
Application: The detected name of the application in use.
Protocol: The detected network protocol used by the application.
From: The source IP address and port associated with this flow.
To: The destination IP address and port associated with this flow.
Details
Here you will find a table of detailed information about the network flow and its associated components. This includes things like (Bitdefender) content category, UTM interface and network zone, MAC addresses and much more.
SSL Details
If the flow is SSL encrypted, then you will see here some details which could be obtained from the SSL connection itself.
Network History
Here you can view all historical traffic sessions recording in 5 second intervals for the previous 12 hours of time.
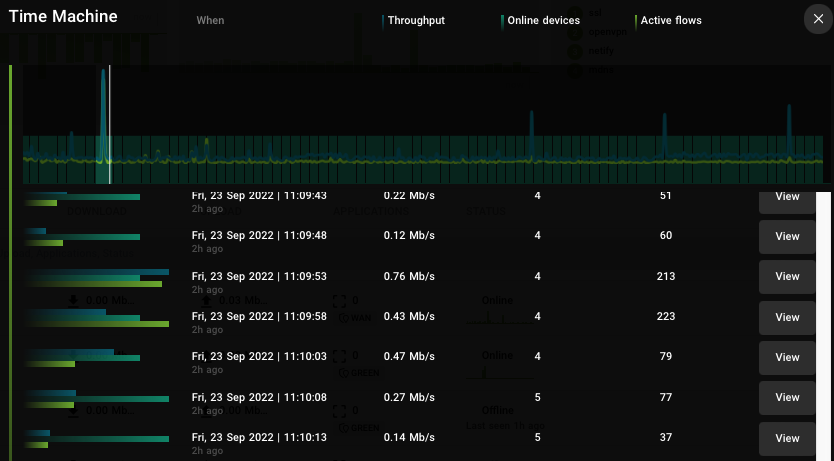
Across the top is an interactive graph displaying network activity for the previous 12 hours from the current time. To view a particlar window of time you can move the cursor over the graph and a vertical line appears as a “marker” which you can then click to display the network data from that specific time window. The items displayed on the interactive graph include throughput, number of online devices, and active flows. For each marker entry you will see the following:
Graph: The graph illustrates the proportional amount of throughput, number of online devices and active flows whose numbers are represented in subsequent columns.
When: The full date and time are displayed for the captured time period.
Throughput: The total throughput during the captured time period.
Online devices: The total number of online devices during the captured time period.
Active flows: The total number of active flows during the captured time period.
: Click this to “replay” the network activity from Your Network. In this replay window, you can see all activity that occurred during the captured time period (by default 5 seconds). Once done you can exit the replay by clicking or view the previous or next time period by clicking or .