New in version 6.5: Network Awareness
Network Analytics
This page is part of part of the Endian Network Awareness feature set which displays historical network information and displays at a glance so administrators can monitor bandwidth consumption of the various types of applications and protocols.
Your Network
By default, the network data is sampled every 5 seconds to give you a real-time view of what’s happening on your network. In addition, you will find a button and drop-down described below:
: This will pause the live network recording. This can be useful when want to freeze the data in the current window. Once clicked, you can resume live data display by clicking .
Time Frame: Changing this drop-down will update the page to show the network information for the various time frames including “Last minute”, “Last Hour”, “Last Day” and “Since last reset”
Note
When selecting “Since last reset” a new button appears enabling the user to reset the statistics. This can be useful if you wish to clear out the history to start a new recording for activity monitoring.
Across the top of this section are three real-time graphs and charts:
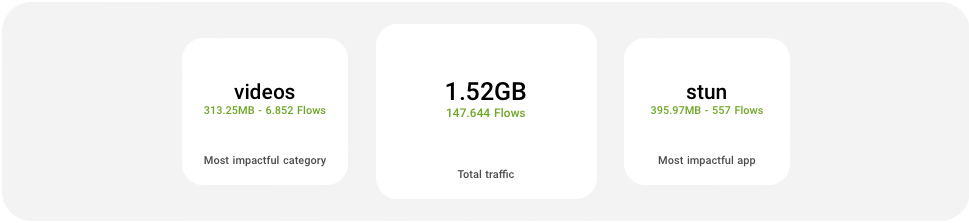
Most impactful category: View the Bitdefender destination category which has consumed the most bandwidth (collectively). Additionally displayed are the total bandwidth consumed and total number of flows for all category traffic.
Total traffic: View the total amount of bandwidth consumed for all monitored traffic. Additionally displayed is the total number of flows for all traffic.
Most impactful app: View the application which has consumed the most bandwidth. Additionally displayed are the total bandwidth consumed and total number of flows for the application.
Applications Tab
Here you can see a real-time report showing the total and individual statistics for each application category. This can provide an at-a-glance view of the application activity on the network for selected time period. The following information is displayed:
All applications: This has visual and text representation for all application categories which have generated traffic on the network (during the selected time period). The visual representation is a thin donut chart which contains a real-time number for the total traffic and flows seen for all network activity. If the user hovers over this chart, it turns into a thick donut chart which display the traffic by each application category. Next to the chart is a list of all the application categories and the total traffic for each.
Underneath a similar detailed view can be found for each of the named application categories.
Protocols Tab
Here you can see a real-time report showing the total and individual statistics for each protocol category. This can provide an at-a-glance view of the protocol activity on the network for selected time period. The following information is displayed:
All protocols: This has visual and text representation for all protocol categories which have generated traffic on the network (during the selected time period). The visual representation is a thin donut chart which contains a real-time number for the total traffic and flows seen for all network activity. If the user hovers over this chart, it turns into a thick donut chart which display the traffic by each protocol category. Next to the chart is a list of all the protocol categories and the total traffic for each.
Underneath a similar detailed view can be found for each of the named application categories.
Categories Tab
Here you can see a real-time report showing the total and individual statistics for each Bitdefender traffic category. This view is useful for mapping network activity back to Bitdefender categories for web filtering (web proxy) purposes. The following information is displayed:
All categories: This has visual and text representation for all Bitdefender categories which have generated traffic on the network (during the selected time period). The visual representation is a thin donut chart which contains a real-time number for the total traffic and flows seen for all network activity. If the user hovers over this chart, it turns into a thick donut chart which display the traffic by each Bitdefender category. Next to the chart is a list of all the Bitdefender categories and the total traffic for each.
Above the table, different widgets are shown.
On the right-hand side, a set of buttons will allow to populate the chart listings with either traffic or flow-based numbers; by default it will show Traffic devices, or you can select Flows simply by clicking on the button.