The Logs Menu
In the logs section of the Endian UTM Appliance the complete overview and management of the logs can be done.
The submenu on the left-hand side of the screen contains the following items:
- Live - get quick, live view of the latest log entries as they are being generated
- Summary - get daily summaries of all logs (generated by logwatch)
- System - system logs (/var/log/messages) filtered by source and date
- Service - logs from the intrusion detection system (IDS), OpenVPN and antivirus (ClamAV)
- Firewall - logs from the IP firewall rules
- Proxy - logs from the HTTP proxy the SMTP proxy and the content filter proxy
- Settings - specify log options such as how long log files should be kept
- Trusted Timestamping - securily time stamp your log to verify they have not been altered.
New in version 2.4: Trusted Timestamping has been added to the 2.4 (Intel) update release of 28 Sep. 2011.
Basically, there are two modalities to access the log from the GUI: live and “by-service”, provided by the logwatch log analyser. In a nutshell, the live log view is a real time visualisation of the log files, provided as they are created, while the “by-service” log shows only the logs produced by one daemon or service.
Live
When you enter in the Logs section, or when you click on the Live entry on the sub-menu, you will see the Live log viewer, which shows you the list of all the log files that are available for real time viewing. You can select the logs you want to see by ticking the corresponding checkboxes. After clicking on the Show selected logs button, a new window with the selected logs will open. If you want to open a single log file, you can click on the Show this log only link in the respective row, while if you want to see them all, you can select the Select all tickbox. You can always change these values from the new window that has opened.
The live log viewer output, shown in the lower part of the window, can become poorly readable if many logs are showed (especially the firewall log, which can produce more log entries per second), so you can reconfigure the settings on the upper part of the table, in the Settings box.
On the right side of the Settings box is shown the list of the logs that are currently displayed, and with which color they are highlighted, while on the left side some additional control elements are shown, that help limit the output:
- Filter
- Only the log entries that contain the expression in this field are shown.
- Additional filter
- Like the filter above, but applied to the output of the first filter. In other words, only log entries containing both expression are shown in the log.
- Pause output
- Clicking on this button will prevent new log entries from appearing on the live log. However, after clicking the button once more, all new entries will appear at once, quickly scrolling the old ones.
- Highlight
- All the log entries that contain this expression will be highlighted in the chosen color. The difference with the filtering option is that all the content is still displayed and the log entries containing the expression will be highlighted with a coloured background.
- Highlight color
- By clicking on the colored square you can choose the color that will be used for highlighting.
- Autoscroll
- This option is only available if in the Menubar ‣ Logs ‣ Settings section, the Sort in reverse chronological order option is turned off. This causes all the new entries to be shown at the bottom of the page: If this option is enabled, then the list is scolled upwards to show the latest entries on the bottom of the page, otherwise only the older entries are show and you must use the scrollbar to the right to see the new ones.
If you want to add or remove some log from the display, you can click on the Show more link right below the list of the log files that are shown. The controls will be replaced by a table in which you can select the log files you want to see by checking or unchecking the respective checkboxes. If you want to change the color of a log file you can click on the color palette of that log type and then choose a new color. To show the controls again you can click on one of the Close links below the table or below the list of the displayed log files. Finally you can also increase or decrease the window size by clicking on the Increase height or Decrease height buttons respectively.
Logwatch
The logwatch log analyser creates reports from logs files that are separated for each daemon, e.g., the ClamAV antivirus or the SMTP proxy, and for each service, e.g., the OpenVPN server or the traffic from the RED zone and are also divided by date. Moreover, a message will inform you if on a given date there are no logs available: This can happen if the daemon or service were not running, or if they did not produce any log entry.
The sub-menu entries System, Service, Firewall, and Proxy group together different services and daemons which have similar characteristics. Several settings are available to search within the log, or view only some entries of the log, many of which are common to all the services and daemons. There are only two exception: the System menu item and the HTTP report tab under Proxy, which have their own special settings.
- Filter
- Only the lines that contain the entered expression are shown.
- Jump to Date
- Directly show log entries from this date.
- Jump to Page
- Directly show log entries from this page in your result set. you can configure how many entries per page are shown on the Menubar ‣ Logs ‣ Settings page.
- Update
- After you change one of the four settings above, clicking on this button will refresh the page content.
- Export
- When you click on this button the log entries are exported to a text file.
The logs are shown in the lower part of the screen. It is possible to see older and newer entries of the search results by clicking on the Older and Newer buttons right above or below the list of entries.
In the remainder of this section, all the services and their peculiar settings are presented.
Summary
On this page you can see your Endian UTM Appliance‘s log summary. Unlike the other services, it has its own settings to control the level of details of the summaries. The following control elements are available:
- Month
- From this drop-down menu, you can select the month of the date that should be displayed.
- Day
- This second drop-down menu allows to pick the day of the date that should be displayed.
- <<, >>
- By using these controls you can go one day back or forth in the history. The content of the page will be automatically refreshed.
- Update
- After you selected the Month and the Day, by clicking this button the page content will be refreshed.
- Export
- By Clicking on this button will open a plain text file with logwatches output.
Note that summaries are not available for the current day, as they are generated every night for the day before.
System
In this section you can browse through the various system log files. On the upper box, Settings, you can define search criteria to tailor the entries displayed in the lower box. Besides teh standard setting, you can choose two additional controls:
- Section
- The type of logs you want to display, either All or only those related to a given service or daemon. Among others, they include kernel messages, SSH access, NTP, and so on.
New in version 2.4: Trusted Timestamping has been added to the 2.4 (Intel) update release of 28 Sep. 2011.
- Sign log
- When you click on this link, the current log is signed.
Service
Here you can find the logs for three of the most important services provided by the Endian UTM Appliance: the IDS, OpenVPN, and ClamAV. No settings besides the common ones are available.
Firewall
The firewall log search contains the messages that record the firewall’s activities. No settings besides the common ones are available.
Proxy
The proxy log viewer shows the logs for four daemons which use the proxy. Each of them has its own tab: squid (HTTP, HTTP proxy), dansguardian (content filter), sarg (HTTP report, the Squid Analysis Report Generator), and smtpd (SMTP, email proxy).
While the log wiever for smtpd has no additional options, those for squid and dansguardian allow these settings to be specified:
- Source IP
- Show only the log entries containing the selected source IP Address, chosen from a drop-down menu.
- Ignore filter
- A regular expression that filters out all the log entries that contain it.
- Enable ignore filter
- Tick this checkbox if you want to use the ignore filter.
- Restore defaults
- Clicking on this button will restore the default search parameters.
Moreover, the HTTP report tab has only one option: To enable or not the proxy analysis report generator, by ticking the Enable checkbox and clicking on Save afterwards. Once the report generator is activated you can click on the Daily report, Weekly report and Monthly report links for detailed HTTP reports.
Settings
On this page you can configure the global settings for the logging of your Endian UTM Appliance, organised into four groups: Log viewing options, Log summaries, Remote logging, and Firewall logging
- Number of lines to display
- How many lines are displayed per log-page.
Sort in reverse chronological order
If this is enabled, then the newest log entries will be displayed first.
- Keep summaries for *__* days
- How long should log summaries be preserved.
- Detail level
- The detail level for the log summary: the higher the level, the more log entries are saved and showed.
- Enabled (Remote Logging)
- Ticking this box allows to enable remote logging. The next option allows to enter the hostname of the syslog server.
- Syslog server The hostname of the remote server, to which
- the logs will be sent. The server must support the latest IETF syslog protocol standards.
- Log packets with BAD constellation of TCP flags
- If this is enabled the firewall will log packets with a bad constellation TCP flag (e.g. all flags are set).
- Log NEW connections without SYN flag
- If this is enabled new TCP connections without SYN flag will be logged.
- Log accepted outgoing connections
- If you want to log all accepted outgoing connections this checkbox must be ticked.
- Log refused packets
- If you enable this all refused packets will be logged by the firewall.
To save the settings, click on the Save button.
Trusted Timestamping
Trusted timestamping is a process that log files (but in general any document) undergo in order to track and certify their origin and compliance to the original. In other words, trusted timestamping allows to certify and verify that a log file has not been modified in any way by anyone, not even the original author. In the case of log files, trusted timestamping proves useful for example, to verify the accesses to the system or the connections from the hotspot’s users, even in cases of independent audits.
Trusted timestamping is disabled by default, but you can enable it, by clicking on the grey switch. When it turns green, some options will show up, that you need to configure.
Timestamp server URL
The URL of the timestamp server (also called TSA) is mandatory, since it will be this server that signs the logfiles.
Note
You need to enter a valid URL of a valid TSA to be able to use trusted timestamping. Several Companies can supply this kind of service.
- Http authentication
- If the timestamp server requires to authenticate, you can tick the box below the Http authentication label.
- Username
- The username used to authenticate on the timestamp server.
- Password.
- The password used to authenticate on the timestamp server.
Public key of the timestamping server
To ease and to make the communication with the server more secure, you can import the public key of the server. You can search for the certificate file on your computer by clicking on the Browse... button, and then upload in to the Endian UTM Appliance by clicking on the Upload button. After the certificate has been stored, next to the Public key of the timestamping server label, a Download link will appear, that you can click to retrieve the certificate, for example if you need to install it on another Endian UTM Appliance.
How Trusted Timestamping works
Once you have clicked on the Save button, the settings are stored and, on the next day, a new button will appear in the Logs section, on the right-hand side of the Settings box (circled in red in Figure TT1): when clicked it will show a message in a yellow callout to inform about the status of the log.
The timestamping process, indeed, starts only after the log files are rotated for the first time after the activation of the trusted timestamping. Usually, logrotate runs daily during the night, so you should wait until the next day to verify that the log files have been certified. When the log are rotated, the TSA client calculates a hash value for each log file, and sends it to the TSA, which signs this value and returns it to the client. The signed value will be used to verify that the log file has not been corrupted or modified in any way, but it is exactly the same as it was created and signed. The idea is that whenever you modify a file, its md5 hash value changes considerably, so even adding a single character will completely modify the file’s md5 hash code.
Do not forget:
None of your log files is sent to the TSA, only their hash value.
The first time that the trusted timestamping service is active, only the hash values of the previous day’s log files are sent to be signed. If you want to sign all the log files, you should enter the CLI via SSH (or use the web console, Menubar ‣ System ‣ Web Console) and issue the following command:
root@localhost:~# /usr/local/bin/timestamp_log_archives -d -f
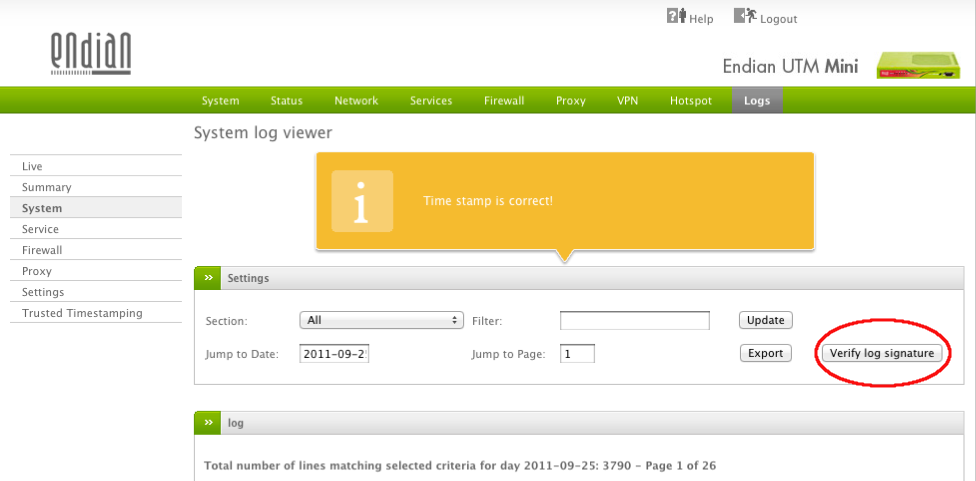
Figure TT1: Log’s trusted timestamping.
All the log files that have been signed since the trusted timestamp service had been activated in the Endian UTM Appliance, can be verified by clicking on the Verify log signature button.
See also
The official OpenSSL timestamping documentation and RFC 3161, the original definition of the Time Stamp Protocol.