The Status pages present you with a VERY thorough list of information regarding the current status of your Endian Firewall. The first subsection, System Status, displays the following in top-down order:
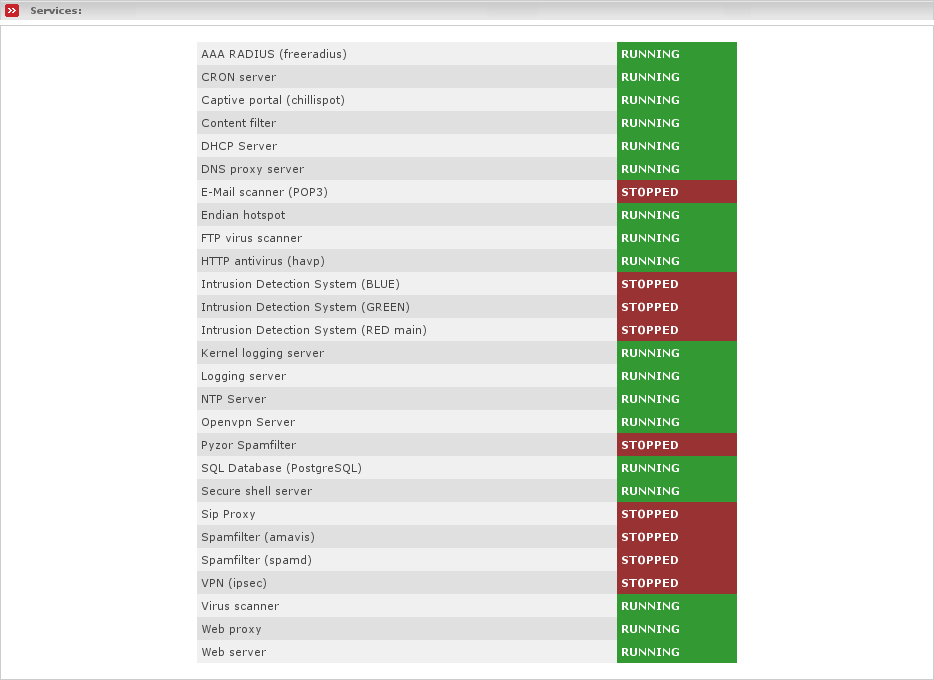
Services - Displays which services are currently running. You may use this display to control if all services which you enabled are currently really up and running. Services which are not enabled are listed as stopped services, so no worries about them. If you find services which in fact should be running then it may solve the problem if you simply restart that service.
Displays the memory/swapfile usage on your EFW box.
This is the formatted output of the tool free. Basically it displays the amount of existing (Size) physical (RAM) and virtual (Swap) memory. The amount of existing memory actually reflects the memory which is available for user applications. For both, physical and virtual memory, you can see the amount of currently used and free memory. The percentage helps you to better figure out the numbers.
You may notice that after the system has been running for a while it reports a really small amount of free memory. To explain this it is needed to strike out a bit and explain basically how the kernel manages the memory. Since disk I/O access is really slow compared to memory I/O access and since files normally get read multiple times, the kernel tries to cache the read data within the disk cache within RAM. The chance is quite high to read out the same data again from the faster cache instead from the slow disk - if the data actually exists in the cache of course. Therefore the kernel fills up all your free memory with disk cache to never waste free RAM. You can see the amount of disk cache as cached in the screenshot above. But no worries, the kernel dynamically frees memory which is used as disk cache as soon as applications need it. To get a clue about how much memory really will be left as free memory to applications you have the line -/+ buffers/cache. That line shows you the amount of used and free memory without the amount of kernel buffers and disk cache. If that line shows you that you have no more free memory, then your machine begins to heavily use the swap and probably may get into performance problems. In this case it may be better to add some additional RAM chips. You may find additional information on Linux System Administrator's Guide.
Disk Usage - Displays the output of df, which reports the amount of total (Size), used and free disk space on your Endian Firewall.
Note
The mountpoint /dev shows up as it was mounted twice. This is a known issue but has no side-effects.
Uptime and Users - Displays the output of the w command which reports the current time, information about how long your system has been running without reboot, the number of users that are currently logged in and the system load averages for the past 1, 5 and 15 minutes.
If any user is currently logged in, which normaly should not be the case if you are not logged in, you will see a table with information for each user, including his/her login name (USER), the tty name which has been used for login (TTY), the IP address of the remote host from which he/she is logged in (FROM), the timestamp of the login (LOGIN@), the amount of time the user was idle (IDLE), the CPU time used by all processes of the logged in user on this tty (JCPU), the CPU time used by the current process which the user actually runs (PCPU), the process which the user currently is runnning (WHAT).
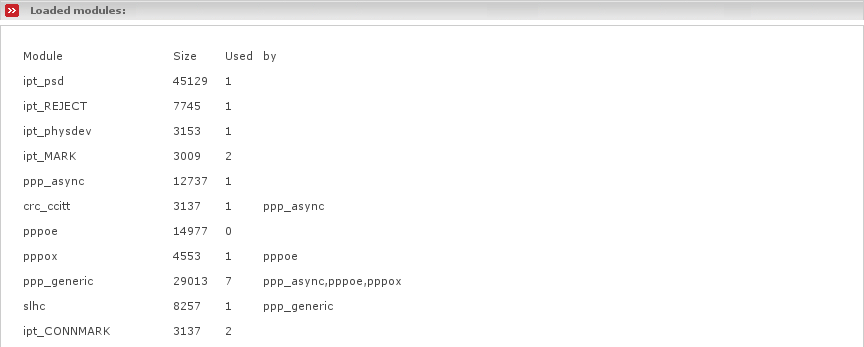
Loaded Modules - This displays all modules currently loaded and in use by the kernel.
Kernel Version - This displays information on the EFW Kernel itself. This is the output of uptime -a. It displays the kernel name, the hostname, the kernel version with release information, the timestamp from when it has been built, the architecture for which it has been built and the name of the operating system.


