The Dashboard Menu
In this page you find:
The Dashboard menu provides important at-a-glance information about the 4i Edge X and its components.
New in version 6.0: The Dashboard menu.
Overview
The Dashboard Overview is the default landing page, the one that is displayed upon every login. It encompasses several boxes (“plugins”) organised in two columns that provide a complete overview of the running system and of its status and health. The top of each box reports the name of the box, and a click on the reload icon on the right-hand side of the title bar immediately reloads the information in the plugin, which are nonetheless updated at regular intervals.
The available plugins and the information they display are described next.
General Information Plugin
It shows several information about the installed system. It usually presents the hostname and domainname of the 4i Edge X in the title.
Hostname: The hostname and domain name
Appliance: The appliance type.
Version: The version of the firmware.
Uptime: The time since the last reboot.
Update status: A message depending on the 4i Edge X status:
. No updates are available.
. New packages can be installed: A click on the message leads to the Updates page where it is possible to review the list of new packages.
. The system has not yet been registered to Endian Network: Go to the Endian Network page on the 4i Edge X (), in which to compile a form to complete the registration.
Maintenance: The remaining days of validity of the maintenance support, or the string.
Support access: Whether the support team can access the 4i Edge X or not. In the former case, it is also shown the date until the access is granted.
Hint
Support access can be enabled or disabled under .
Network Interfaces Plugin
It shows information about the network interfaces of the firewall and the traffic. The upper part of this plugin shows several data about the network interfaces of the 4i Edge X: Their name, type, link (Up if a connection is established, Down otherwise), and the In- and Outgoing traffic. The latter two data are updated in real-time.
When ticking the checkbox near the device name, that device is shown in the graphs underneath. The devices’ name is coloured according to the zone they serve.
The lower part of the plugin contains two charts: The first one shows the incoming traffic, while the second one the outgoing traffic.
The traffic of each interface is coloured according to the zone it belongs to; Bridges built on one device are shown in the same colour as the device. and different interfaces belonging to the same bridge are shown with a different shade of colour.
Like the traffic data in the upper part, both charts are updated in real-time.
Hint
Up to six interfaces can be selected and shown in the charts.
Services Plugin
This plugin carries information about events recorded by some of the services installed on the 4i Edge X and their actual status. Active services are marked with the message, with the otherwise. For each running service is shown a summary of the tasks accomplished during the last hour and the last day.
Hence, if some number in the summaries sounds strange or not common compared to the normal activities (e.g., the IDS has detected some attack), the logs can be controlled to search for some useful message that has been recorded.
The only supported service on the 4i Edge X is:
Intrusion Detection: The number of attacks logged by snort.
Hint
Inactive services are marked with the message.
Memory Plugin
This plugin shows information about the memory usage of the 4i Edge X, taken from the free -m Linux command’s output. It features the usage of Total, Free, Cached, and Buffers memory.
See also
The linux memory management is clearly described in this page.
New in version 6.0.
Uplinks Plugin
This plugin shows a table detailing the uplinks’ connection status. For each defined uplink are shown name, IP address, and uptime. A coloured dot on the left of the name shows the status of the uplink.
Changed in version 6.0: Simplified for improved readability.
Signature updates plugin
This plugin shows the signatures downloaded on the 4i Edge X and the date of the last update. If no service has ever started, that uses signatures, the table will be empty.
Note
If for one uplink the option Disable signature updates if uplink is online is active (see ), signatures will not be downloaded.
CPU Load Plugin
New in version 6.0.
This plugin shows the load of each core of the CPU.
CPU x: The load of the CPU, where x represents the CPU number, for those appliance that have more than one CPU.
Disks Plugin
It shows information about each partition mounted on the 4i Edge X, which is provided graphically, with a small bar and percentage of used space, and in numbers, with the used and total space used.
Warning
A partition on the hard disk (e.g., main disk, data disk, and especially /var/log) must never be filled up more than 95% or more, as this can cause service disruption and data loss.
See also
There are a few suggestions to free space on filled up partitions in this guide on Endian help portal.
New in version 6.5: Network Awareness
Your Network
This page is part of part of the Endian Network Awareness feature set which displays real-time interactive network information at a glance so administrators can analyze and react (if necessary) to dangerous or inappropriate network activity.
Overview
By default, the network data is sampled every 5 seconds to give you a real-time view of what’s happening on your network. This is indicated by the Live data as shown in the upper right. In addition, you will find three buttons described below:
: This will pause the live network recording. This can be useful when want to freeze the data in the current window. Once clicked, you can resume live data display by clicking .
: This will open the Network History interface where you can view and replay network activity from the last 12 hours.
: This will open the Settings page with the following options:
Your Agent ID - This display your Network Awareness Network ID which is unique to your 4i Edge X.
Enable flow processing - Enable this feature to locally capture and process network flow information. Disabling this feature will disable the local processing and display of network data.
Enable active scan - Enable this feature to allow the Endian to scan detected hosts for information like IP/MAC addresses, operating system, and running services information.
- Click to save any changes made on this page.
Across the top of this section are three real-time graphs and charts:
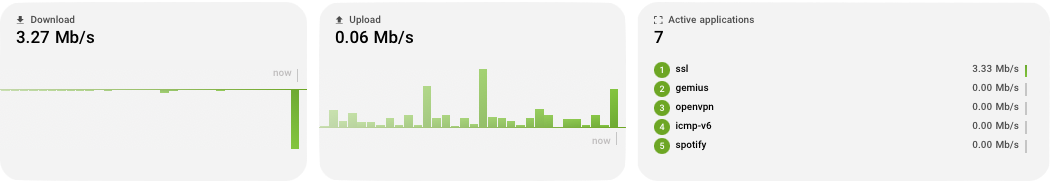
Download: View the download activity of your network in real-time. Shows the download activity in a rolling chart that display the previous 3 minutes of activity. The height of each bar represents the amount of download proportional to the previous activity.
Upload: View the upload activity of your network in real-time. Shows the upload activity in a rolling chart that display the previous 3 minutes of activity. The height of each bar represents the amount of upload proportional to the previous activity.
Active applications: The large number listed under the heading indicates the real-time total number of applications detected on the network based on all active flows. Underneath are the top five (5) applications in use on the network updated in real-time. The list displays the applications in order from highest throughput (upload or download) of a given application.
Devices Tab (Table)
Here you can see a real-time table of the devices detected on the networks sorted by default in descending order of the highest throughput (upload or download). Essentially you are viewing the most “active” devices in the network based on current throughput - those who are sending or receiving the most network data. The following information is displayed for each of the devices listed:
Name: This shows the name of the device which is displayed based on the available information in the following order:
Manual user entry: Using the device editor an admin can explicitly set the name they wish to display for a given device.
DHCP hostname: If the 4i Edge X is acting as a DHCP server and a given device offers its hostname as part of the DHCP process, this will be displayed.
IP address: If none of the above are available, then the IP address of the device is displayed.
Underneath the name is displayed the MAC address and the vendor (usually device manufacturer) based on a MAC vendor lookup.
Download: The current download throughput for this device.
Upload: The current upload throughput for this device.
Applications: Here the number of applications detected for this device are displayed along with a badge representing the network zone associated with the device.
Status: This can be one of two values:
Online: If the host has been recently active (within the last 3 minutes), then it will display Online with a graph underneath representing recent activity.
Offline: If the device has not been active recently (within the last 3 minutes), the it will display Offline with an indication of time lapsed since the device was last seen on the network. By default, after 30 days the host will be removed from the device history.
Device Details: On the far right is a button
which will pop-up the device details interface on the right-hand side of the page with the following information:
At the top right are pop-up window controls including:
Pop-out Window: Click here to make the Device Detail window a standalone, movable window. Once clicked, you can reattach to the side of the window by selecting this button again.
Minimize: Click here to minimize the Device Detail window to the bottom. This makes the window easily accessible again from the main interface.
Close: Click here to close the pop-up window.
Overview
Edit icon: Click to manually set device name or delete device.
Download: The total download throughput for this device.
Upload: The total upload throughput for this device.
MAC address: The MAC address of the device.
IP addresses: Here is listed all detected IPv4 and IPv6 addresses of the device.
Hostnames: Here is listed all the detected hostnames of the device.
Network Activity Graph: A graph representing recent network activity of the device.
Below you will find a tabbed interface with the following items:
Info: Here will be listed any detectable Operating System information including OS name, version, type and vendor.
Flows: Here you can see all real-time flows which contain this device as a source or destination and includes:
From: Displays the source IP address along with source port and detected application in use.
To: Displays the destination IP address and port.
Throughput: Displays the real-time throughput values including both upload and download.
Services: Here you can find detected services running on the device. The services are detected via a active scan which is queued after a new host is detected. If no services were detected by the scan, then no services will be shown.
Above the table, different widgets are shown.
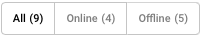
On the right-hand side, a set of buttons will allow to populate the table with only the devices that are in a given state; it is possible to show All devices, or only those that are in a current state of Online or Offline simply by clicking on the button.
Flows Tab (Table)
Here you can see a real-time table of the network flows detected on the networks sorted by default in descending order of the highest throughput (upload or download). Essentially you are viewing the most “active” connections in the network based on current throughput - those who are sending or receiving the most network data. The following information is displayed for each of the flows listed:
Application: This displays the name of the detected application in addition to the network protocol identified, the destination fully-qualified hostname (if available) and the associated 4i Edge X network zone.
From: This displays the source device name along with associated IP address and port.
To: This displays the destination device name along with associated IP address and port.
Download: The current download throughput for this flow.
Upload: The current upload throughput for this flow.
Flow Details: On the far right is a button
which will pop-up the flow details interface on the right-hand side of the page with the following information:At the top right are pop-up window controls including:
Pop-out Window: Click here to make the Flow Detail window a standalone, movable window. Once clicked, you can reattach to the side of the window by selecting this button again.
Minimize: Click here to minimize the Flow Detail window to the bottom. This makes the window easily accessible again from the main interface.
Close: Click here to close the pop-up window.
Overview
Throughput: The total of the upload and download throughput for this flow.
Total traffic: The total amount of network traffic sent for this flow.
Generated by: The detected device type (if available).
Application: The detected name of the application in use.
Protocol: The detected network protocol used by the application.
From: The source IP address and port associated with this flow.
To: The destination IP address and port associated with this flow.
Details
Here you will find a table of detailed information about the network flow and its associated components. This includes things like (Bitdefender) content category, 4i Edge X interface and network zone, MAC addresses and much more.
SSL Details
If the flow is SSL encrypted, then you will see here some details which could be obtained from the SSL connection itself.
Network History
Here you can view all historical traffic sessions recording in 5 second intervals for the previous 12 hours of time.
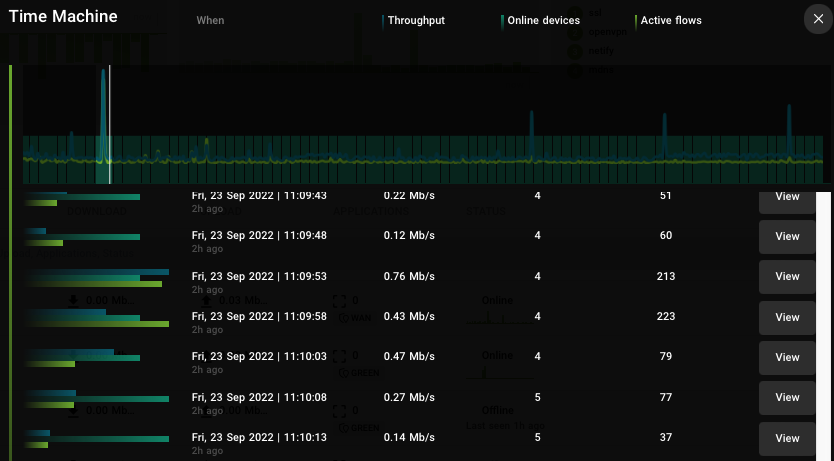
Across the top is an interactive graph displaying network activity for the previous 12 hours from the current time. To view a particlar window of time you can move the cursor over the graph and a vertical line appears as a “marker” which you can then click to display the network data from that specific time window. The items displayed on the interactive graph include throughput, number of online devices, and active flows. For each marker entry you will see the following:
Graph: The graph illustrates the proportional amount of throughput, number of online devices and active flows whose numbers are represented in subsequent columns.
When: The full date and time are displayed for the captured time period.
Throughput: The total throughput during the captured time period.
Online devices: The total number of online devices during the captured time period.
Active flows: The total number of active flows during the captured time period.
: Click this to “replay” the network activity from Your Network. In this replay window, you can see all activity that occurred during the captured time period (by default 5 seconds). Once done you can exit the replay by clicking or view the previous or next time period by clicking or .
New in version 6.5: Network Awareness
Network Analytics
This page is part of part of the Endian Network Awareness feature set which displays historical network information and displays at a glance so administrators can monitor bandwidth consumption of the various types of applications and protocols.
Your Network
By default, the network data is sampled every 5 seconds to give you a real-time view of what’s happening on your network. In addition, you will find a button and drop-down described below:
: This will pause the live network recording. This can be useful when want to freeze the data in the current window. Once clicked, you can resume live data display by clicking .
Time Frame: Changing this drop-down will update the page to show the network information for the various time frames including “Last minute”, “Last Hour”, “Last Day” and “Since last reset”
Note
When selecting “Since last reset” a new button appears enabling the user to reset the statistics. This can be useful if you wish to clear out the history to start a new recording for activity monitoring.
Across the top of this section are three real-time graphs and charts:

Most impactful category: View the Bitdefender destination category which has consumed the most bandwidth (collectively). Additionally displayed are the total bandwidth consumed and total number of flows for all category traffic.
Total traffic: View the total amount of bandwidth consumed for all monitored traffic. Additionally displayed is the total number of flows for all traffic.
Most impactful app: View the application which has consumed the most bandwidth. Additionally displayed are the total bandwidth consumed and total number of flows for the application.
Applications Tab
Here you can see a real-time report showing the total and individual statistics for each application category. This can provide an at-a-glance view of the application activity on the network for selected time period. The following information is displayed:
All applications: This has visual and text representation for all application categories which have generated traffic on the network (during the selected time period). The visual representation is a thin donut chart which contains a real-time number for the total traffic and flows seen for all network activity. If the user hovers over this chart, it turns into a thick donut chart which display the traffic by each application category. Next to the chart is a list of all the application categories and the total traffic for each.
Underneath a similar detailed view can be found for each of the named application categories.
Protocols Tab
Here you can see a real-time report showing the total and individual statistics for each protocol category. This can provide an at-a-glance view of the protocol activity on the network for selected time period. The following information is displayed:
All protocols: This has visual and text representation for all protocol categories which have generated traffic on the network (during the selected time period). The visual representation is a thin donut chart which contains a real-time number for the total traffic and flows seen for all network activity. If the user hovers over this chart, it turns into a thick donut chart which display the traffic by each protocol category. Next to the chart is a list of all the protocol categories and the total traffic for each.
Underneath a similar detailed view can be found for each of the named application categories.
Categories Tab
Here you can see a real-time report showing the total and individual statistics for each Bitdefender traffic category. This view is useful for mapping network activity back to Bitdefender categories for web filtering (web proxy) purposes. The following information is displayed:
All categories: This has visual and text representation for all Bitdefender categories which have generated traffic on the network (during the selected time period). The visual representation is a thin donut chart which contains a real-time number for the total traffic and flows seen for all network activity. If the user hovers over this chart, it turns into a thick donut chart which display the traffic by each Bitdefender category. Next to the chart is a list of all the Bitdefender categories and the total traffic for each.
Above the table, different widgets are shown.
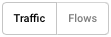
On the right-hand side, a set of buttons will allow to populate the chart listings with either traffic or flow-based numbers; by default it will show Traffic devices, or you can select Flows simply by clicking on the button.